Insights
Ali Abdaal Changed Direction Four Times: What All 1,458 Videos Reveal
Ali Abdaal's channel has changed direction four times. Going from medical school admissions to study technique, his typical views grew nearly 11x in 18 months. In 2025 and 2026 he made more than 2x as many videos about money as about self-improvement, BUT the self-improvement videos got more than 2x the views.
Ali Abdaal had 6.69 million subscribers and 560,960,982 lifetime views on 14 September 2026. His public library runs to 1,458 videos. Fourteen of them are livestreams, which are held out of every figure below because a livestream is a different kind of video with a much smaller typical audience. That leaves 1,444 uploads: 683 long-form videos and 761 Shorts.
I pulled his whole library from the YouTube API, with every view, like and comment count. A 2018 video has had eight years to collect views, so comparing raw totals would make old videos look like winners. Instead, each long-form video is compared only with the long-form videos he published in the same six months, and only once it's at least 90 days old. 674 long-form videos qualify.
The analysis in this article comes from the same process Stewart runs on client channels every month inside Channel Intelligence.
What he gets right
There are six patterns. The rest of the article gives you the data behind each one.
- His fastest growth came after his first change of direction. When he moved from medical school admissions to study technique, his typical long-form video went from 22,095 views in late 2017 to 239,945 in early 2019, nearly 11 times as many in 18 months. By late 2023 it was 740,329.
- In 2025 and 2026, his self-improvement videos beat his money videos. Of his scored long-form videos, 25 are about money and 10 are about self-improvement, and the self-improvement videos got more than twice the views, each measured against his typical video from the same six months.
- Plain "how to" titles beat his other titles. 63% of his "how to" videos beat the typical video of their own six months, against 46% of his other long-form videos, and they came out ahead in all four periods measured.
- His biggest videos solve everyday problems. Typing faster, a Cambridge essay method, a skincare routine and why you're always tired all sit in his all-time top ten, with nine passive income ideas at number one.
- He's used one category since mid-2019. At least 94% of his long-form uploads in each era since then are filed as Education, including the videos about making money.
- He built a big Shorts library and has recently made far fewer. Shorts are 53% of his uploads and 20% of his views. He published 7 in July 2026 and 6 in August, against about 23 a month over the ten months before.
The Takeout: These patterns come from Ali Abdaal's library, at his size and in his subjects, so treat each one as something to test on your own channel. Pick one, check it against your own videos, and keep it only if your numbers agree.
1. Four changes of direction, from medical admissions to money
The channel has been about five different subjects in nine years. The last two overlap, because the book and personal brand were added on top of the money videos. Each card counts the long-form uploads published in that era.
The sharpest change sits between the two halves of 2021. In the first half, 10 of his 49 long-form titles carried a tech word. In the second half, none of his 35 did. Money and business words went from 8% of his long-form titles in the first half to 17% in the second.
Money and business words have stayed between 11% and 26% of his long-form titles in every half-year since, and reached 26% in the second half of 2025.
His fastest growth came after the first change. His typical long-form video went from 22,095 views in the second half of 2017 to 239,945 in the first half of 2019, nearly 11 times as many in 18 months, and doubled again to 481,812 in the second half of 2019. Through the move to money in 2021, his typical video stayed at about half a million views, at 505,426 in the first half of 2021 and 487,037 in the second. Older videos have had longer to collect views, so these figures understate the growth after the first change.
The shifts follow his own life. He made admissions and study videos as a medical student, then videos about the tools he used to work, then videos about money and online business once the channel had become a business of its own. Each move kept a link to the subject before it. That's my interpretation of the timeline, and public data can't show why he made each move.
The Takeout: If your channel's subject needs to change, write down how the new subject connects to the one your current viewers came for before you publish the first video on it. Each of Ali Abdaal's moves grew out of what he was already doing, and you can plan your own change the same way.
2. In 2025 and 2026, his self-improvement videos beat his money videos
Of his 74 scored long-form videos from January 2025 onward, 25 have a money or business word in the title and 10 are about self-improvement: habits, discipline, success, goals and changing your life. One title fits both lists and is left out of each.
The 10 self-improvement videos have a median of 2.05x the typical video of their own six months, and 8 of them beat it. The 25 money videos have a median of 0.97x, and 12 of them beat it. In lifetime views, the typical self-improvement video has 510,270 and the typical money video has 203,579.
The best self-improvement video is Success Is Hard Until You Build Systems Like This, from February 2026, at 1.6 million views and 7.35x its six months. How to Change Your Life came in at 4.94x and Make 2026 the Best Year of Your Life (Evidence-Based) at 3.27x. The best money video was How To Get Rich, at 3.22x.
Ten videos is a small sample, so treat this as a pattern to watch and not as proof. It matches his all-time top ten, where eight of the ten videos are about skills and everyday problems and two are about money.
The Takeout: Split your recent videos into the ones about what you sell and the ones about the wider problems your buyers have, and compare each video with the videos you published in the same six months. If the wider videos win, keep making them, and link each one to a video about what you sell so the extra viewers have somewhere to go next.
3. A plain promise beats a big number
124 of his 674 scored long-form videos have "how to" in the title, leaving out two music covers of the song How to Save a Life. Their median is 1.28x the typical video of their own six months, against 0.94x for his other 550 long-form videos.
A median can be pulled up by a handful of big hits, so the clearer measure is how often a video beats its own six months. 63% of the "how to" videos do, against 46% of the rest. The format is on nearly one scored video in five, so that advantage is spread across more than a hundred videos.
The advantage shows up in every period, and it's much bigger in some than in others. From 2016 to 2019, the years of his admissions and study videos, "how to" titles had a median of 2.87x against 0.83x for the rest, and 19 of those 21 videos beat their own six months. In 2020 and 2021 the two were almost level, at 1.03x against 1.00x. They pulled apart again in 2022 and 2023, at 1.27x against 0.93x, and since 2024 the difference is modest, at 1.10x against 0.96x.
So the early study videos lift the overall 1.28x. In all four periods, a "how to" video has beaten its own six months more often than not, and his other titles have done so less often than not.
Putting himself in the title works as well. The 50 titles containing "How I" have a median of 1.22x, and 62% of them beat their own six months. How I Type REALLY Fast (156 Words per Minute) is one of them, at 11.0 million views. Titles that simply start with I or My come out about average or slightly above, between 1.04x and 1.12x depending on exactly which openings are counted, so they don't show a clear effect either way.
Both kinds of title tell the viewer what they'll be able to do or learn. Titles built around a number don't show the same lift. The 322 titles with any digit in them have a median of 0.97x, and titles built around money or business words come out roughly average, between 0.97x and 1.02x depending on the word list used.
The Takeout: Split your own long-form titles into those that promise a skill or a method and those that lead with a number or a money word, then compare each video with the videos you published in the same six months. If the plain promises win on your channel too, you've found a title format your audience already responds to, and using it more often costs you very little.
4. Trends and patterns across the eras
The typical video grew from 2017 to 2023
Every video in this article is scored against the median of its own six months, and those medians show how the channel grew.
The typical long-form video from the second half of 2017 has 22,095 views. The typical one from the second half of 2023 has 740,329, even though those videos have had about a third as long to collect them, a median of 1,077 days against 3,273. There were dips along the way, in the first half of 2020 and the second half of 2022, but the growth through the medicine, study, tech and early money eras is real, and the lifetime numbers understate it.
Videos published after 2023 haven't had long enough to be compared this way. Their lifetime totals are lower, but measured as views per day the newest complete half-year is ahead, at 1,205 a day for the typical video against 703 for the second half of 2023. Views per day favours new videos, because most videos collect views fastest in their first months, so neither measure can say from public data whether the typical video has done better or worse since 2023.
The Takeout: Plot your own typical video by six-month period and put the median age of each period's videos beside it. A period that looks weaker might just be younger, and that check stops you dropping a subject that's still working.
The plain titles worked through every change of subject
The "how to" advantage from the section on titles shows up in every era. From admissions interviews in 2017 to starting a business in 2025, a "how to" video beat its own six months more often than not in every period, and his other titles did so less often than not. It was strongest from 2016 to 2019, at 2.87x against 0.83x, and modest since 2024, at 1.10x against 0.96x, so the subject changed four times and the title format kept working in each one.
The Takeout: When you change subject, keep the title format your audience already responds to, so the main new thing a returning viewer has to judge is the topic.
Far more uploads, most of them Shorts
His public library holds 94 uploads from 2021 and 267 from 2024, with livestreams left out. Most of that growth is Shorts: 10 in 2021 and 193 in 2024. Shorts are now 761 of his 1,444 uploads, 53%, and they've returned 110,893,460 of the 551,312,896 views across those uploads, 20%. 517 of his 761 Shorts were published from 2024 onward, so most of them have had less time to collect views than the long-form library.
Both formats have slowed recently. He published between 11 and 33 Shorts a month from September 2025 to June 2026, about 23 on average, then 7 in July 2026 and 6 in August. Long-form went from about 4 a month between September 2025 and May 2026 to 3 in June, 2 in July and 2 in August. Two months isn't much data and a summer gap can be a holiday, so this shows a slowdown in output and doesn't yet show why.
The Takeout: Work out what share of your views your Shorts return, then compare it with the share of your production time they take. If a format is half your output and a fifth of your result, it needs to be doing a job you can name, like sending people to a specific long-form video, or it's the cheapest thing on the channel to cut.
His biggest videos solve everyday problems
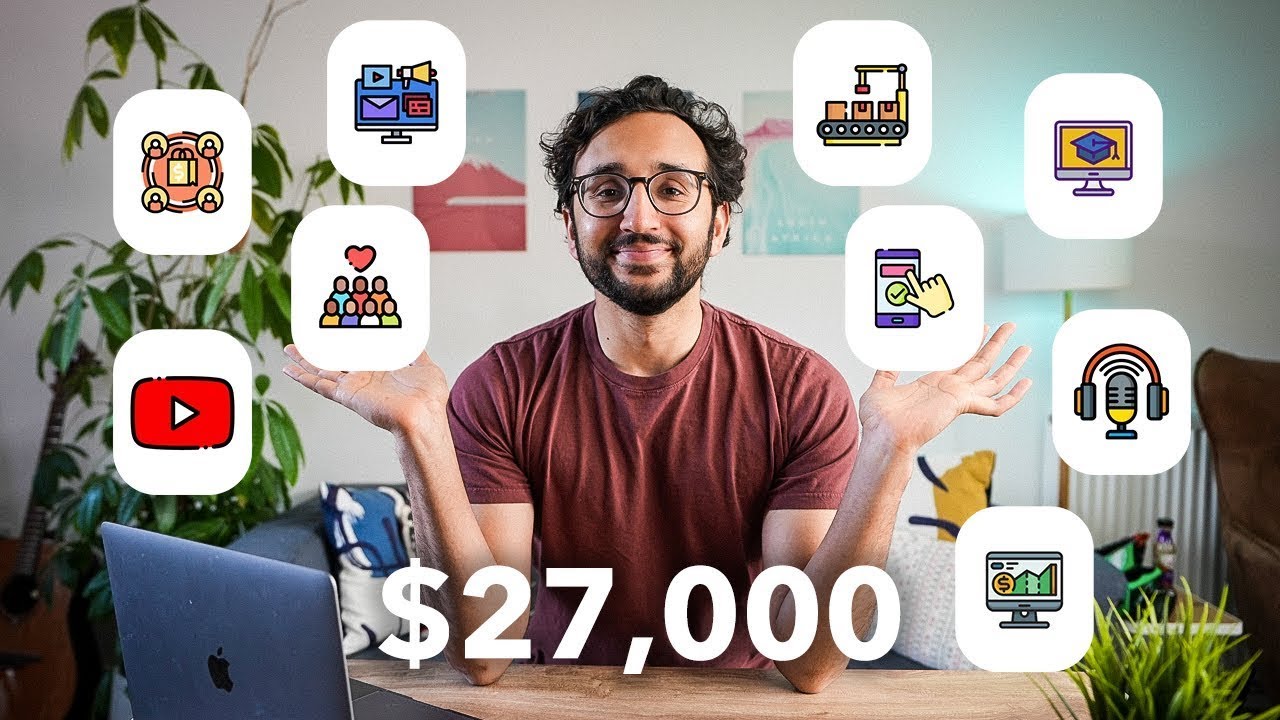
His all-time top ten is led by 9 Passive Income Ideas - How I Make $27k per Week at 14.0 million views. Below it are How I Type REALLY Fast at 11.0 million, How to Invest for Beginners at 9.4 million, a Cambridge essay memorisation method at 9.0 million, My Evidence-Based Skincare Routine at 8.9 million and Why You're Always Tired at 6.4 million. The other four cover iPad note-taking, time management, exam revision and starting a YouTube channel.
Two of the ten are about money. The other eight are about skills and everyday problems, from typing speed to sleep, and seven of the ten were published before the money era began in mid-2021. Seven of the ten also have "how to" or "How I" in the title.
An all-time list favours older videos, so it shows what built the audience more than what works today. One explanation is that broad, useful topics brought in a large audience first, and the money and business videos were later made for the audience those topics built. That's an interpretation of the order things happened in, and public data can't prove it.
The Takeout: If you sell something specialist, make some videos about the broader problems your buyers have before they're ready to buy. A wider audience that already knows you gives your specialist videos more people to reach when you publish them.
One category since mid-2019
Since mid-2019 he's filed nearly all his long-form videos in YouTube's Education category, including the ones about making money: 94% in the tech era and 99% in the money era. Across all 1,444 uploads it's 1,314, or 91%. The early videos were filed differently. In 2017 only 32% of long-form uploads were Education, and in the study era 65 of 113 were filed as People and Blogs.
The category is one of the few things you tell YouTube directly about a video. What it does to distribution isn't visible from outside an account, so any effect is a hypothesis. The data does show that he settled on one category in mid-2019, the half-year his typical video roughly doubled, and kept it through the move from tech to money.
A channel gets two places to tell YouTube what subject it covers. One is the category on each video. The other is the channel keywords box, and when I looked at what 20 UK business channels had put in theirs, five had filled in nothing at all and the fifteen that had used it claimed 247 different subjects between them.
The Takeout: Open your last 20 videos in Studio, check the category under Show more on each one, and count how many different ones you've used. If your channel has one subject and three categories, you're giving YouTube three different descriptions of the same subject, and changing a video's category takes under a minute.
Put simply
Ali Abdaal's channel has changed direction four times in nine years. His typical video grew nearly 11x in the 18 months after the first change and stayed level through the move to money in 2021. In 2025 and 2026 his self-improvement videos got more than twice the views of his money videos, and in every period a plain "how to" title beat his typical video more often than not.
His subjects followed his life, his category settled in 2019, and the videos that built his biggest audience were about problems most people share. A business channel can copy each of those without copying his subject, and check it against its own library first.
Method and limitsSources, dates, definitions and what this can't see
Public data only. The full library of 1,458 videos was pulled from the YouTube API on 9 September 2026 with every view, like and comment count, and every figure in this article was re-derived from that pull on 14 September 2026. Subscriber and channel view counts were checked again on 14 September. YouTube reported 1,462 videos that day, so four aren't in the analysis, either because they sit outside the public uploads playlist or because they went up after the pull.
Fourteen livestreams were identified from their live-streaming details and held out of every sample and every baseline. YouTube's public data carries no Shorts flag, so format is assigned by length: 62 seconds or less before 15 October 2024, and 182 seconds or less after it, when YouTube raised the Shorts limit.
Each long-form video is scored against the median of the long-form videos published in the same calendar half-year, and only videos at least 90 days old are scored. Half-years with fewer than five videos aren't used. That leaves 674 scored videos. The four periods in the title chart are calendar blocks: 2016 to 2019, 2020 to 2021, 2022 to 2023 and 2024 to 2026. Lifetime views rise with age, so a newer half-year with a higher median is good evidence of growth, while a newer half-year with a lower median may simply be younger. That's why the half-year chart stops at 2023 and no decline is claimed.
The 2025 and 2026 comparison covers the 74 long-form videos published from 10 January 2025 to 11 June 2026 that were at least 90 days old at the pull. Self-improvement titles contain change your life, best year, habit, discipline, success, goal, dopamine or journal. Money titles contain a dollar sign, money, rich, income, million, business, financial, wealth, invest, side hustle or passive. 7 Obsessive Habits That Turned Me Into a Multi-Millionaire matches both lists and is left out of both.
"How to" titles contain the words "how to" anywhere, excluding two music covers of the song How to Save a Life, which are counted with the other titles. "How I" titles contain "How I" anywhere, including one "How I'd". The first-person range comes from counting titles whose first word is I, I'm or My, with and without I've and lower-case variants. The money range comes from three word lists, the widest being a dollar sign or the words money, rich, income, million or business. The era title shares use a tech list (iPad, iPhone, Mac, MacBook, iMac, Apple, app, keyboard, laptop, camera, tech, gear, setup, Notion, Kindle and a few product names) and a money and business list (a dollar sign, business, money, income, entrepreneur, freelance, side hustle and passive).
YouTube changed how it counts a view on 24 August 2026. Two of the 1,458 videos were published after that date, and the 90-day rule excludes both from every score. The other videos' lifetime totals include about two weeks counted the new way, and because every score compares videos from the same six months, both sides of each comparison carry that same stretch.
A paid-traffic screen was run on the ten most-viewed videos, comparing each one's like rate and comment rate with this channel's long-form norms of 3.09% and 0.130%. Like rates ran from 1.87% to 4.56%, and none of the ten had both rates suppressed, which is the pattern bought views leave, so none looks bought. Three have comment rates below half the norm alongside normal like rates, which is typical of a video that travelled well beyond its usual audience.
There's no Studio access here, so nothing in this article estimates impressions, click-through, retention, traffic sources or revenue. Where a cause is suggested, it's labelled as an interpretation or a hypothesis.
Analysis and write-up: Stewart Read.

Meet Stewart
Stewart Read
YouTube Growth Strategist
Stewart has run YouTube channel management for 8-figure businesses - turning channels into reliable sources of leads, clients, and measurable revenue, not just views.
Using a class-leading suite of channel analysis tools he built himself, he pinpoints exactly what makes your audience click, watch, and convert - then turns those findings into videos that bring buyers to your business.
Channel Intelligence
The monthly service behind this analysis. A written briefing on what your channel returned to the business, a video walkthrough of the findings recorded by Stewart personally, and a plan for the videos to make next.
See how Channel Intelligence works